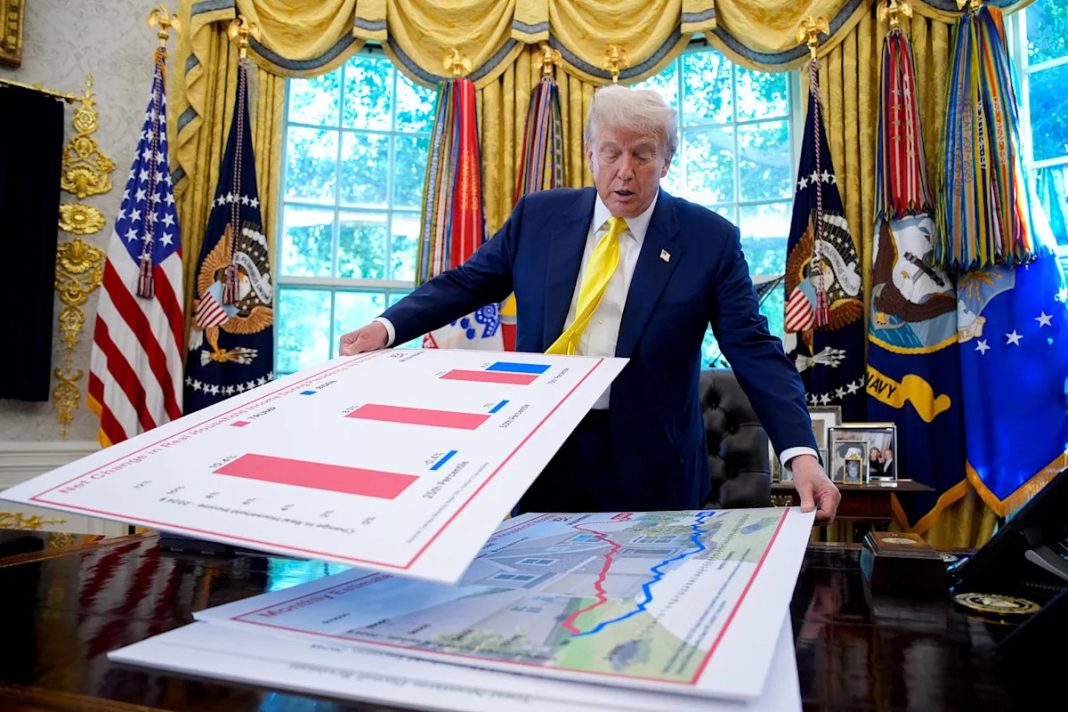
On Thursday, President Donald Trump took a break from gilding the Oval Office to summon the media for a presentation in a decidedly less flashy medium: printed charts. Less than a week after he responded to a disappointing jobs report by firing the commissioner of the Bureau of Labor Statistics, Trump showed reporters a handful of charts with data he liked much more. Tellingly, all but one of the charts compared the economic record of his first term with that of President Joe Biden’s. Only one chart (which purported to show rising median household incomes) concerned the current state of the economy.
Outside the Oval Office, though, most experts aren’t describing this economy in golden terms. One term that is coming up more frequently is “stagflation.”
“Stagflation concerns ripple through Wall Street as tariffs hit,” read one Bloomberg headline Thursday. JPMorgan analysts see “tariff-induced US ‘stagflationary’ slowdown in 2025,” Reuters reported in June. “It’s beginning to smell a lot like stagflation,” economist Paul Krugman wrote Friday.
To help bridge the almost dizzying gap between the president and reality, here’s a question-and-answer guide.
What is ‘stagflation’?
It’s a portmanteau of “stagnation” and “inflation.” A stagflationary economy suffers from lower economic growth and steeper price increases. This combination limits policymakers’ options: Most tools to fight inflation (such raising interest rates) risk hurting economic growth, while most tools to boost growth (such as increased government spending) risk increasing inflation.
Has it happened before?
The last stagflation era in the U.S. began in the 1970s and spanned the presidencies of Richard Nixon, Gerald Ford, Jimmy Carter and (the early years of) Ronald Reagan. Amid oil price shocks and the U.S. going off the gold standard, stagflation gripped the American economy and did not let go for years. By the summer of 1980, inflation reached over 14% and unemployment was at 7.5%. Only after the economy suffered multiple recessions and the Federal Reserve hiked interest rates to over 20% did the U.S. escape stagflation’s grasp. Millions of Americans suffered. Trump, on the other hand, survived thanks to a “small loan from my father” of nearly $60 million.
Why are experts worried about stagflation now?
Because inflation is ticking up and economic growth and job creation are ticking down. On the price front, U.S. consumers face “an overall average effective tariff rate of 18.6%, the highest since 1933,” according to the Yale Budget Lab. The tariffs are starting to show up in prices as companies run through pretariff stockpiles.
At the same time, in addition to the slowing pace of job creation, GDP growth averaged 1.3% for the first half of the year, down sharply from the last couple years. As economist Claudia Sahm points out, wage growth and unemployment rates remain largely unchanged, suggesting a reduced supply of laborers. Not coincidentally, as Immigration and Customs Enforcement carries out mass deportations, the number of foreign-born workers is declining. “The employment statistics,” Sahm concludes, “are broadly consistent with the reduction in immigrant labor supply.”
More tariffs and fewer immigrants — those sound like Trump’s signature campaign promises?
They were.
And is he currently carrying out these campaign promises?
He is.
In other words, this was all predictable?
Yes. Incredibly.
Who provided Trump the charts?
Stephen Moore, an economist at the conservative Heritage Foundation, America’s leading think tank for misleading numbers.
What were Moore’s sources for rising household income?
“We have access to some data that no one else has,” said Moore. This “unpublished Census Bureau data,” he said, will be published “some time in the next six months.” Until that release, it’s difficult to confirm the data independently.
Why does the name Stephen Moore sound familiar?
Because you, a discerning consumer of news, remember Trump planned to nominate him to the Federal Reserve’s board of governors in 2019. Moore “decided to withdraw,” in Trump’s words, when Senate Republicans (who at the time still occasionally possessed spines) signaled they would not support his nomination.
Why did Senate Republicans oppose him?
It’s hard to say. Few of them shared their reasoning, and Moore’s record gave them so many potential reasons, including, as The Atlantic’s David A. Graham wrote, “some peculiar views about women, both related and unrelated to the economy.”
The issue in his record most relevant to Thursday’s presentation is Moore’s relationship with the truth. As economics columnist (and current MSNBC host) Catherine Rampell pointed out while he was being considered for the Fed, Moore claimed the country was suffering from deflation (price decreases) when it wasn’t and flip-flopped entirely on stances depending on which party occupied the White House.
“At best he cherry-picks data,” Rampell wrote Friday. “At worst he makes it up entirely. No one should report whatever garbage he’s turned into visual aids as bearing any resemblance to reality.”
Trump postponed his tariffs after the stock market dropped. If stagflation indeed takes hold, can we expect Trump to change course?
No. Blanket tariffs and immigrant purges are two stances Trump will never truly abandon. The president’s views on trade have been consistent for at least 40 years; his commitment to demagoguing about immigration is just as ironclad. The “Liberation Day” tariffs are largely in place, and Republicans in Congress voted to give ICE well over $100 billion for more deportations. A U-turn on either policy is extremely unlikely.
What if I want to pretend everything’s going to be just fine?
Then boy do I have some charts for you.
This article was originally published on MSNBC.com

